VSCode is a general purpose IDE whereas CLion is a niche IDE for C and Cpp.
To setup a C++ project in VSCode with the same capabilities that CLion has we’ll need to perform the following steps:
Search and install the C/C++ extension from Microsoft

Write your first cpp program:

Now if you want to build and run the program, you may use the play or debug symbol at the top right of the IDE:

The first thing you’ll face is a question on whether to use one compiler or the other. If you are using Apple Silicon you’ll probably want to use Clang++, if you are on a different platform, search which is the recommended compiler on that platform.
Either you use Run or Debug, the result will be the same, it will run it in the debug console.
Now there are two things to address:
- How to run the program outside the debug console? (so we can not only output data to the console but also insert values to the program)
- Enable the code linter by default (so we can spot errors earlier)
1. Run the program outside of the debug console
To run the program outside the debug console we can simply open a terminal and run the compiler and run commands like so:
Open a new terminal (Terminal → New Terminal), i’m using bash but you can use any other.
Run the command clang++ myProgramFileName. E.g. clang++ index.cpp
This will generate an output file, it’s a.out by default. Now we can run it through the same terminal like you’ll do with any .sh or similar, this is: ./a.out
Full picture:

It should be possible to automate this process but I believe that will do for the course, if you have a workaround to automate this integrated within VSCode feel free to add it in the comments.
2. Enable the linter
Now, if you started the course, you’ll see that when @Mosh tells us “here you’ll see a warning” on Fundamental Data Types -> 5- Narrowing video you simply won’t.
This is because you need to enable the linter. You can do it for the opened file, all files and so manually by using Command + Shift + P on mac or Ctrl+Shift+P on Windows and typing `>c++ analysis:

Now if you want to automate this (recommended) we can do it through VSCode Settings like so:
1- Go to settings:
code -> settings -> settings or search for Settings (UI)

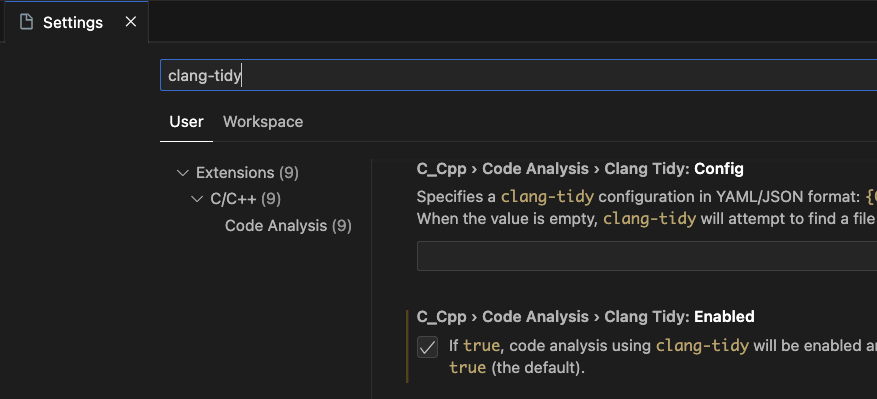
2- Search for Clang-Tidy and enable it:
And that’s all for now, shall you have any question or recommendation I’m all ears ![]()
Happy coding

